

こんにちは、なかにしです。
どうしようもなくグラフを書きたい時期ってありますよね。
ちょうど今その時期なので、1分以内でReactを使用したグラフを書きます。
前提
・React ^18
・TypeScript ^4
サクッと作るよ!
グラフと言えば ChartJs !!!
…ですが、
React用に React-Chartjs-2というものがあるので、そちらを使っていきます。
React-Chartjs-2 はChartJsをReact用に拡張したものだと思ってください 🙂
▽さっそくインポート
npm install --save chart.js react-chartjs-2▽グラフのコンポーネントを作成
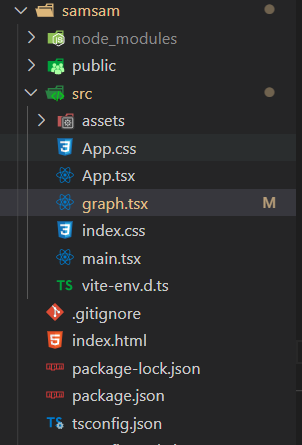
(graph.tsx という名前にしました)
▽中身はこんな感じ
import React from "react";
import {
  Chart as ChartJS,
  CategoryScale,
  LinearScale,
  BarElement,
  Title,
  Tooltip,
  Legend,
} from "chart.js";

ChartJS.register(
  CategoryScale,
  LinearScale,
  BarElement,
  Title,
  Tooltip,
  Legend
);

export const options = {
  indexAxis: "x" as const,
  responsive: true,
  plugins: {
    legend: {
      position: "top" as const,
    },
    title: {
      display: true,
      text: "社員数",
    },
  },
  maintainAspectRatio: false,
};

const labels = [
  "1月",
  "2月",
  "3月",
  "4月",
  "5月",
  "6月",
  "7月",
  "8月",
  "9月",
  "10月",
  "11月",
  "12月",
];

const sampleData = [1, 2, 3, 4, 5, 6, 7, 8, 9, 10, 10, 30];

export const Graph = {
  labels,
  datasets: [
    {
      label: "男性",
      data: sampleData,
      backgroundColor: "rgba(53, 162, 235, 0.5)",
    },
  ],
};
ざっくり説明すると、
①グラフ作成に必須のコンポーネントを ChartJs からインポート
②表示したいデータを入力
③公式の文法通りにコードを書く
です!!
可変部分は②のデータくらいです。
これで「データを持った素材」が出来たので、あとは自分の好きなグラフの型に入れるだけです。
今回は「棒グラフ」を作ります!
▽棒グラフの型をインポートして、
先ほどの素材を入れ込みます。
import { Graph, options } from "./graph";    //先ほど作った素材
import { Bar } from "react-chartjs-2";    // 棒グラフの型

function App() {
  return (
    <div>
      <Bar options={options} data={Graph} />
    </div>
  );
}

export default App;
ローカルサーバーを立ち上げると…
じゃん!!
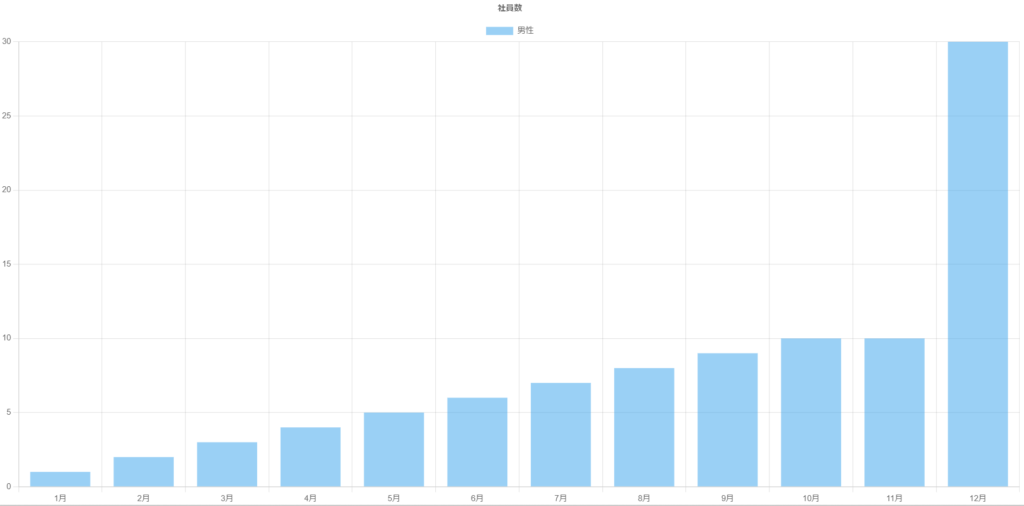
皆さん大好き、棒グラフの完成です!
今は画面いっぱいに広がってますが、高さや幅、太さも調整できます。
ちなみに太さに関しての文献少なすぎてマジで困りました。
高さの調整
コンポーネントに一行追加します。
高さを変えるよ~って宣言みたいなものですね。
import React from "react";
import {
  Chart as ChartJS,
  CategoryScale,
  LinearScale,
  BarElement,
  Title,
  Tooltip,
  Legend,
} from "chart.js";

ChartJS.register(
  CategoryScale,
  LinearScale,
  BarElement,
  Title,
  Tooltip,
  Legend
);

export const options = {
  indexAxis: "x" as const,
  responsive: true,
  plugins: {
    legend: {
      position: "top" as const,
    },
    title: {
      display: true,
      text: "社員数",
    },
  },
  maintainAspectRatio: false,   //追記
};

const labels = [
  "1月",
  "2月",
  "3月",
  "4月",
  "5月",
  "6月",
  "7月",
  "8月",
  "9月",
  "10月",
  "11月",
  "12月",
];

const sampleData = [1, 2, 3, 4, 5, 6, 7, 8, 9, 10, 10, 30];

export const Graph = {
  labels,
  datasets: [
    {
      label: "男性",
      data: sampleData,
      backgroundColor: "rgba(53, 162, 235, 0.5)",
    },
  ],
};
▽Bar に高さを指定します。
import { Graph, options } from "./graph";
import { Bar } from "react-chartjs-2";
function App() {
return (
<div>
<Bar options={options} data={Graph} height="500px" /> //heightを追記
</div>
);
}
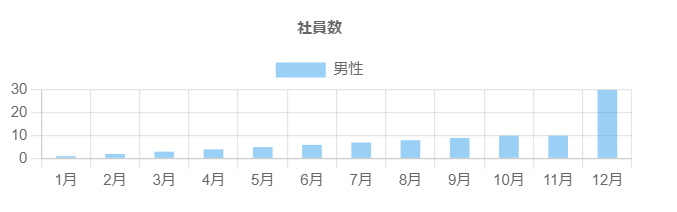
export default App;これで高さが500pxになりました。
横幅の指定
「」です。
▽responsive をfalseにします。
import React from "react";
import {
  Chart as ChartJS,
  CategoryScale,
  LinearScale,
  BarElement,
  Title,
  Tooltip,
  Legend,
} from "chart.js";

ChartJS.register(
  CategoryScale,
  LinearScale,
  BarElement,
  Title,
  Tooltip,
  Legend
);

export const options = {
  indexAxis: "x" as const,
  responsive: false,   //falseに変更
  plugins: {
    legend: {
      position: "top" as const,
    },
    title: {
      display: true,
      text: "社員数",
    },
  },
};

const labels = [
  "1月",
  "2月",
  "3月",
  "4月",
  "5月",
  "6月",
  "7月",
  "8月",
  "9月",
  "10月",
  "11月",
  "12月",
];

const sampleData = [1, 2, 3, 4, 5, 6, 7, 8, 9, 10, 10, 30];

export const Graph = {
  labels,
  datasets: [
    {
      label: "男性",
      data: sampleData,
      backgroundColor: "rgba(53, 162, 235, 0.5)",
      barPercentage: 0.5,
    },
  ],
};
▽width を設定します。
import { Graph, options } from "./graph";
import { Bar } from "react-chartjs-2";
function App() {
return (
<div>
<Bar options={options} data={Graph} width="500px" /> // Widthを追加
</div>
);
}
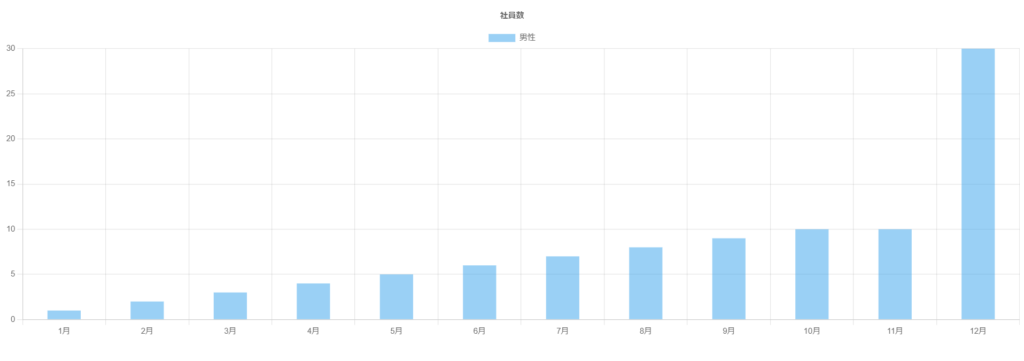
export default App;▽幅が500pxになりました。
太さの指定
「ChartJs グラフ 太さ」で検索しても出てこないです。
結構探すの大変でした。
太さじゃないのか…?
でも幅だと全体のWidthが出てくるしな…
太さは「barPercentage」です。
初期値は0.9になっており、小さくすると幅が狭くなります。
▽幅を縮める
import React from "react";
import {
  Chart as ChartJS,
  CategoryScale,
  LinearScale,
  BarElement,
  Title,
  Tooltip,
  Legend,
} from "chart.js";

ChartJS.register(
  CategoryScale,
  LinearScale,
  BarElement,
  Title,
  Tooltip,
  Legend
);

export const options = {
  indexAxis: "x" as const,
  responsive: true,
  plugins: {
    legend: {
      position: "top" as const,
    },
    title: {
      display: true,
      text: "社員数",
    },
  },
  maintainAspectRatio: false,
};

const labels = [
  "1月",
  "2月",
  "3月",
  "4月",
  "5月",
  "6月",
  "7月",
  "8月",
  "9月",
  "10月",
  "11月",
  "12月",
];

const sampleData = [1, 2, 3, 4, 5, 6, 7, 8, 9, 10, 10, 30];

export const Graph = {
  labels,
  datasets: [
    {
      label: "男性",
      data: sampleData,
      backgroundColor: "rgba(53, 162, 235, 0.5)",
      barPercentage: 0.5,                             // 追記
    },
  ],
};
▽狭くなりました。
番外編: もっと遊ぶ
色々な機能を追加してみました。
・「型変換ボタン」で棒グラフと折れ線グラフをチェンジ
・「軸変換ボタン」でX軸とY軸をチェンジ
データやラベルを可変にして使い回せるようにしました。
▽型変換
▽軸変換
こちらはGitHubにて公開していますので、興味のある方はぜひ見てください!
さいごに
一番使われているライブラリだけあって、簡単・綺麗ですね!
皆さんもグラフ作りたい!ってときにぜひお使いください 🙂
今回はここまで!
Enjoy Hacking!!